
North Atlantic Scallop Season Update: The First Six Months
Market perspective as of October 2, 2026.
Landings through September 30, 2026.
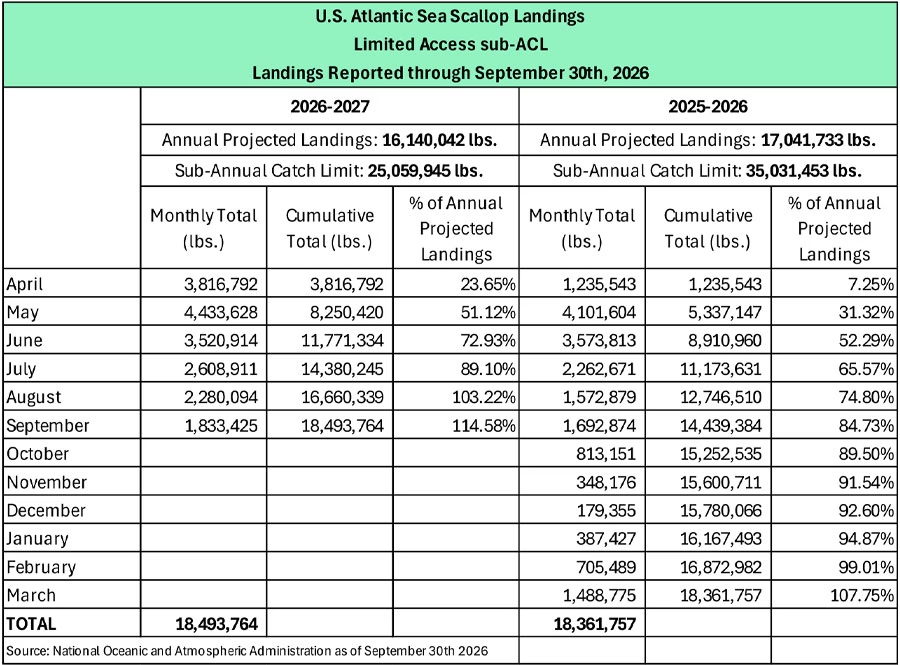
At the halfway point of the 2026-2027 season, U.S. Limited Access scallop landings have exceeded the original full-season projection. Harvest reached approximately 18.49 million pounds through September 30. Larger scallops remain comparatively scarce, despite the stronger overall catch.
There are 3 key developments for seafood buyers and professionals: first-half landings have outperformed expectations, monthly production has slowed since the spring peak, and much of the available catch falls within smaller size ranges. For distributors and foodservice buyers, increased pounds landed does not necessarily result in improved availability across every specification or size.
The North Atlantic Scallop Season at the Halfway Point
The U.S. Atlantic sea scallop fishing season runs from April 1, 2026, through March 31, 2027. October 1 marked the halfway point. The landings figures focus specifically on the Limited Access fleet.
The fishery operates under a management system involving Days-at-Sea and fishing-area allocations.
Through September 30, Limited Access vessels landed 18,493,764 pounds. NOAA lists annual projected landings of 16,140,042 pounds and a Limited Access sub-annual catch limit, or sub-ACL, of 25,059,945 pounds. The first-half harvest therefore represents 114.58% of projected annual landings and approximately 73.8% of the sub-ACL.
Those percentages answer different questions. The projection describes expected production. The sub-ACL identifies the catch limit allocated to this portion of the fishery. Exceeding projected landings does not mean the fleet has exceeded its catch limit. For your team, separating those benchmarks helps prevent an inaccurate reading of an otherwise strong first half.
Strong Cumulative Landings, Slower Monthly Production
Much of the higher production is attributable to increased available fishing effort or days-at-sea. The fleet received approximately 11,779 Days-at-Sea, with nearly 71.5% used by the halfway point. For the current fishing season, full-time permit holders were allocated 36 open-area Days-at-Sea, up from 24 in 2025, with no 2026 access-area allocation. Days-at-Sea refer to allocated fishing time, not pounds of scallops or the number of calendar days remaining in the season.
The practical distinction is important. Half the fishing year remains, but substantially less than half the allocated Days-at-Sea remains unused. The calendar midpoint does not represent an equal division of allocated fishing time.
Monthly landings also show a change in pace. Production peaked at 4,433,628 pounds in May, then declined to 3,520,914 pounds in June, 2,608,911 pounds in July, 2,280,094 pounds in August, and 1,833,425 pounds in September.
These figures support two observations at once. The cumulative harvest remains strong, while recent monthly production runs below the spring peak. A seafood professional reviewing only the season-to-date total would miss the slowdown. Conversely, reviewing only September would result in missing the additional volume landed earlier in the season.
Reading both measures together provides a more useful picture of the midpoint. The cumulative total explains production already recorded. Monthly landings show the pace entering the second half. Neither measure, on its own, establishes how much product will arrive over the remaining six months.
Figure 1. U.S. Limited Access Scallop Landings
How the First Half Compares With the Previous Season
The strongest like-for-like comparison uses the same six months in each season. Vessels landed 14,439,384 pounds from April through September 2025, compared with 18,493,764 pounds during the same months in 2026. Based on the figures above, the increase is approximately 4.05 million pounds, or 28.1%.
The current first-half total also slightly exceeds the entire previous season’s 18,361,757 pounds. This comparison illustrates the strength of early production, but the periods differ. Six months of the current season should not be presented as a completed annual result.
The prior season also demonstrates why the remaining months deserve separate attention. Monthly landings fell during late 2025, then increased during the first three months of 2026. March 2026 production reached 1,488,775 pounds, compared with 179,355 pounds in December 2025. These historical results provide context, not a forecast of an identical pattern this winter.
For buyers and distributors, the useful comparison therefore has two parts: first-half output is ahead of the comparable prior period, and the final season total still depends on production from October through March.
Why Scallop Size Matters as Much as Total Volume
Much of the strong first half is attributed to Mid-Atlantic landings. Those catches increased early-season supply of 10/20 and 20/30 scallops. Actual counts generally averaged between 17 and 24 scallops per pound, while larger scallops represented a more limited portion of available production.
Scallop count describes the number of scallop meats per pound. NOAA Fisheries identifies grades such as 10/20, 20/30, and U/10, with U/10 meaning fewer than 10 meats per pound. Lower counts correspond to larger individual scallops.
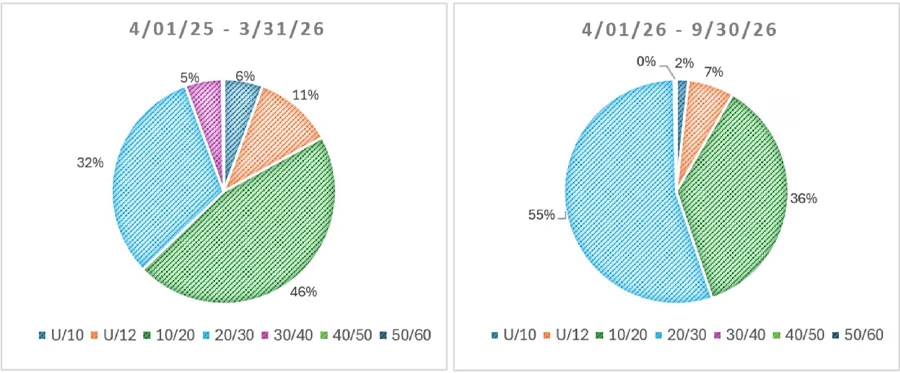
Figure 2. Scallop Size Mix Across Two Reporting Periods
This explains why a stronger overall harvest has not removed pressure on larger sizes. An increase concentrated in 10/20 and 20/30 production does not establish equivalent availability of U/10 or U/12 scallops. The composition of the catch matters alongside its total weight.
There is also an important distinction within 10/20s. Larger scallops averaging 12 to 16 per pound remain scarce and command higher prices. A broad size designation therefore does not fully describe the market position of every product within the category.
For your purchasing and sales teams, actual count deserves attention alongside the listed grade. Discussions about greater 10/20 availability need to distinguish the broader category from the larger scallops within the range. The Premier Foods scallop product lineup provides product-line context for those discussions, while current availability requires confirmation for the specific product and count.
What Size-Distribution Charts Show
The size-distribution charts above reinforce the importance of product mix. In the chart covering April through September 2026, 20/30 scallops represent 55%, compared with 32% in the chart covering the full April 2025 through March 2026 season. The 10/20 share shifts from 46% in the full prior-season chart to 36% in the current first-half chart.
The charts also show a smaller share for the largest categories. U/10 represents 2% in the current first-half chart, compared with 6% in the full prior-season chart. U/12 represents 7%, compared with 11%.
These are comparisons of the percentages shown, not same-period year-over-year measurements. One chart covers twelve months, while the other covers six. The charts also do not provide separate pound totals for each grade.
For commercial readers, the main value is the distribution across sizes, reinforcing a first half concentrated in smaller scallops. The remaining six months will determine the final seasonal mix.
Premier Foods’ Market Perspective for the Second Half
Based on harvest rates and remaining Days-at-Sea, Premier Foods forecasts full-season Limited Access landings of approximately 22 million to 24 million pounds by March 31, 2027. This is Premier’s assessment at the midpoint, rather than a confirmed result or a revision to the catch limit.
Reaching the approximately 25.1 million-pound Limited Access sub-ACL would require relatively strong winter prouction. Remaining catch allowance and expected final landings therefore remain separate measures.
The pricing graphic below also requires the correct commercial context. The chart reports fresh boat-level prices before freezing, packaging, shipping, or processing charges. Those figures describe a different stage of the supply chain from finished-product pricing for a distributor or foodservice customer.
Figure 3. Fresh Boat-Level Scallop Prices by Size
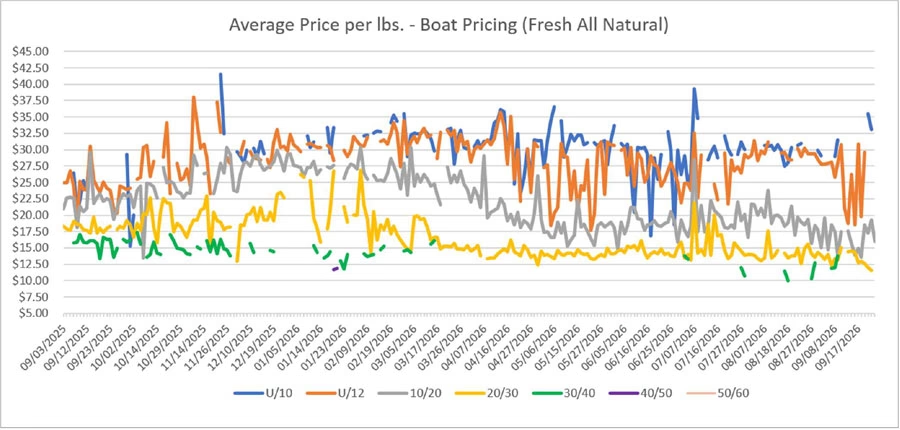
On pricing, Premier expects the market to remain relatively firm through the first quarter of 2027, with the strongest support in U/10, U/12, and the larger scallops within the 10/20 category. Smaller 10/20s and 20/30s have comparatively better supply and are expected to remain more competitive.
The assessment leaves room for different conditions within those categories. Premier anticipates periods of greater 10/20 availability and price resistance. For 20/30s, the company does not anticipate a significant decline unless winter landings substantially exceed its expectations. These are dated market expectations, not guaranteed outcomes.
What to Watch From October Through March
Monthly landings will show whether the recent slowdown continues or production strengthens. Remaining Days-at-Sea will help explain the fishing effort available to support those landings. Read these measures together rather than projecting the first six months forward at the same pace.
The size composition of subsequent catches also deserves attention. Additional pounds would not necessarily change the availability of larger scallops if production remains concentrated in smaller sizes. Premier’s midpoint assessment makes the actual count distribution a central consideration for interpreting future updates.
For your team, the most useful questions concern the specific products your customers require. Are changes occurring in total production, in the relevant size category, or in the larger end of a particular count range? Keeping those questions separate makes market conversations more precise without assuming a particular purchasing response.
To discuss how these developments relate to your scallop program, contact Premier Foods. Bring your required size range and product specifications so the discussion focuses on the categories relevant to your business.
Frequently Asked Questions
When is the halfway point of the 2026-2027 scallop season?
For the U.S. Atlantic sea scallop season covered here, October 1, 2026, marks the halfway point. The season runs from April 1, 2026, through March 31, 2027. Landings in this article are reported through September 30.
Why do landings above projections not mean the catch limit has been exceeded?
Projected annual landings and the Limited Access sub-ACL are different benchmarks. The reported first-half harvest represents 114.58% of the original projection, but approximately 73.8% of the sub-ACL.
Why are larger scallops still comparatively scarce?
Premier reports much of the stronger first-half production came from Mid-Atlantic catches concentrated in 10/20 and 20/30 sizes. Actual counts generally averaged 17 to 24 per pound, so higher overall volume has not translated into equivalent availability across larger sizes.